
It’s too early to herald the end of real estate’s Great Rebalancing.
TAKE THE INMAN INTEL SURVEY FOR DECEMBER
But for now, at least, the fast-paced growth in active listings that real estate professionals became accustomed to in this depressed transaction environment has ground to a halt.
And peering deep into the data, a clear culprit emerges.
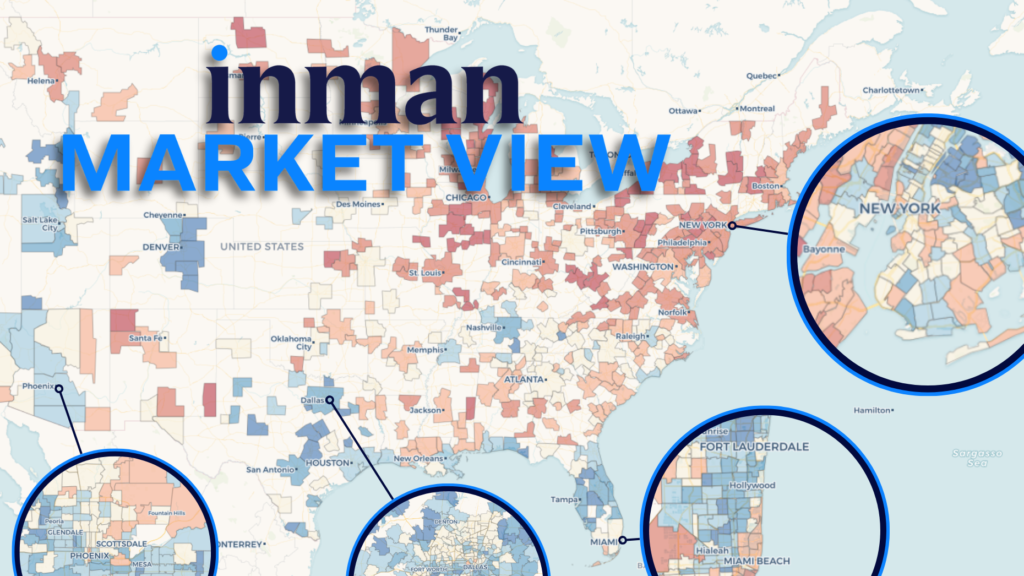
Using newly released data from Realtor.com, the interactive Inman Market View tools below provide a detailed look at how western markets drove the nation’s summer inventory boost — before that boost then slowed down in the fall.
- In the spring market, active-listing inventory nationwide was still growing at an annual rate of 30 percent.
- But by the fall season that just closed, the number of active listings on the market was only 15 percent higher than the same time the year before.
As the number of homes on the market appears to cap out for now, it remains 13 percent below pre-pandemic norms.
With Inman’s interactive maps and charts below, you can explore how your market’s standing inventory pool has changed over time.
Click into one of the 500 local markets in the tool above, or search for an option from the dropdown menu for an even more detailed look at the data. Select different metrics and time-period comparisons for a fuller picture.
From engine to anchor
The map tool above allows easy comparisons of recent data to the fall season in 2017-2019, or to the same period 12 months ago.
But with the chart below, you can take an even closer look at more recent trends for hundreds of markets across the U.S.
It’s loaded up with three of the biggest drivers of the fall 2025 inventory slowdown: San Francisco, Seattle and Denver. (Select your market to see how its path compares.)
Inman’s analysis of Realtor.com data shows that seven of the 11 large markets with the biggest recent losses of upward active-listing momentum were in the western part of the country. These include four markets in California, plus Seattle, Boise and even Denver. Markets in Florida and Texas also participated in this trend.
A typical market in this group saw summer active-listing counts that had risen to somewhere between 30 percent and 90 percent higher than their pre-pandemic baselines. But as the page turned from summer to fall, these same places saw those shares decline by 10 to 20 percentage points.
The result? A national market that had been rapidly rebalancing has reached a period of unusual stasis, with an unclear future direction.
A deeper dive
Within markets, various “hot spots” have emerged where inventory is churning — whether due to sales or delisted properties — faster than new listings can replenish the housing stock.
Below, zoom in, drag and hover over different ZIP codes to see which areas have seen the biggest year-over-year declines in new listings during the three-month period ending in November.
In the greater Bay Area, where inventory was up 3 percent year-over-year in the fall after being up 23 percent year-over-year in the summer, inventory has begun to dry up particularly quickly in the city center of San Francisco. An eastern swath of Oakland — which still has more homes sitting on the market today than it did before the pandemic — has also been falling over the past year.
Every market reviewed by Inman as part of this analysis had its own unique patterns of inventory growth and decline. Search for yours in the tool above to see what things look like near you.


