
A once-robust rebound in new listings that helped shaped the real estate market’s ongoing rebalancing toward buyers continued to lose steam in recent weeks, an Inman analysis of Realtor.com data shows.
But while this trend holds writ large across the nation as a whole, hundreds of markets are following their own distinct paths.
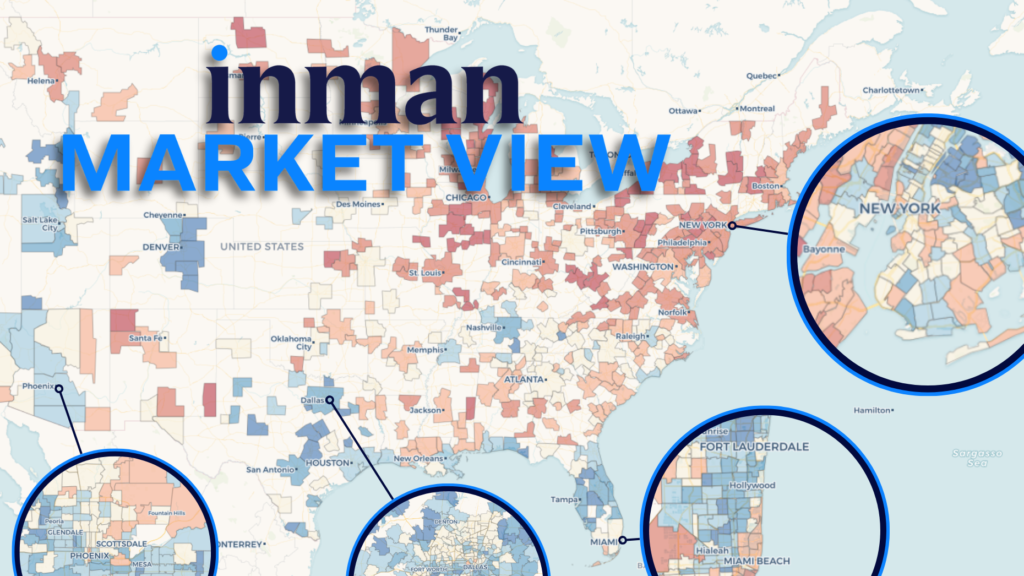
To give real estate agents and brokerage leaders a chance to see how their market stacks up, the Inman data team has updated its Market View series of interactive tools with the latest numbers from Realtor.com.
These numbers — at the national, local, and even down to the ZIP code level — demonstrate in great detail how each market is faring, and how it compares to other markets in its region and the nation as a whole.
Explore the interactive map below to see yours.
These tools are designed to be responsive and interactive, so feel free to explore the data by toggling between different metrics and time periods. Select a market from either the dropdown menu or the map to drill down for a more detailed, hyperlocal view of what’s going on near you.
Taking advantage of multiple metric and time period views offers important context.
If an agent in Nashville were to only look at the default map above, for instance, they might assume that the 18 percent year-over-year drop in new listings recorded in the period from July through September means the floor was falling out from under their local listing market.
But in Nashville, the year-over-year view in fact appears to tell the story of a market snapping back closer to normal following an unusually large influx of listings in the late summer of 2024.
Cases like this are why Inman Market View tools encourage multiple views of the data, including raw numbers as well as a comparison to the same season in a pre-pandemic period from 2017 to 2019.
In Nashville, comparing the data to a pre-pandemic seasonal norm makes clear that new-listing supply has been on a gradual, if volatile, upward trajectory since the summer of 2023 — which is true of much of the nation.
Yet in other metros like Denver, Washington, Atlanta and Dallas, a substantial annual boost in new listings that occurred in the spring was stunted in the summer.
Swap out Nashville for your local market, or add a few more for comparison, in the tool above.
A note on the commission pool
Regular users of Inman’s new Market View data tools may notice that one of the recurring tracking metrics, the potential commission pool, has been removed for now.
Last month’s Inman Market View post went into detail on how interpreting this metric — which is the product of a market’s listing outflow and its list price — has become more and more problematic during a time when pending sales are steady and delistings are on the rise.
This month, we’re pausing the commission pool metric’s use altogether, for essentially the same reasons.
Why track this concept in the first place? Pending sales are often not made available at the local and hyperlocal levels that are displayed on this chart. In Realtor.com’s case, they aren’t made public at all.
But in developing these tools, Inman’s data team found that by calculating a market’s listing outflow — the total number of properties that left the market due to a pending sale or a delisting — and by applying the prevailing list price to those levels, you could get a pretty accurate idea of how a market’s business health was evolving over time.
During normal times, listing outflow behaves very much like pending sales, and change in the metric correlates strongly with future actual sales. This is due to the fact that the number of pending sales outnumbers withdrawn properties in most places. If pending sales went up and delistings went down, the sum total of both would typically fall.
But these aren’t normal times.
In recent months, Realtor.com has demonstrated that the rate of withdrawals is making up an increasing share of all listing activity. And it’s having a visible impact on the rate of change in outflow volume and revenue estimates that it didn’t appear to have in most periods dating back to 2017.
As a result, a loose proxy metric that would have been useful for assessing where individual markets stood in previous years is increasingly unreflective of how the revenue pool is changing over time. Rather than keep it in place, we’re putting it on pause for now.
As the market changes, we will continue to refine these tools and add more features that are useful for brokerages.


